Making Connectomics Mainstream
Neural connectomics is a tantalizing omic layer
The opening statement at a Bio-IT World 2026 plenary session was bold: “Frontier AI has consumed all the text on the internet. It’s running out of biological ground truth. The most consequential missing dataset is the wiring diagram of the brain, with molecular identity, at scale.”
“No one has been able to generate it. Until now.”
Panluminate’s CEO, Ons M’Saad continued with an elegant portrayal of our existing understanding of biology – from the genome’s “blueprint”, to the proteome’s “parts”, and then to the “connectome’s wiring”, with a lock indicating the connection between the parts and the connectome is inaccessible. She then compared three different technologies: electron microscopy (making structure visible), fluorescence microscopy (making molecules visible), and Panluminate’s approach (making both structure and molecules visible). That comparison made clear their approach promised much higher throughput, at much larger scale, at much better molecular resolution, with a much lower cost.
It is a tantalizing prospect: better, faster and cheaper is the product you want to bring to market.
She then illustrated the three types of technologies with a mouse synaptic connection slide, comparing an EM structure, a fluorescence molecular labeling of the same cross-section, and the merge of the two. Their differentiator? A “pan-staining protocol” that is the scientific differentiator, not the instrument, and she pointed to a recent Nature Biotechnology reference. (M’Saad and Bewersdorf et al. Nature Biotech 2025 "All-optical visualization of specific molecules in the ultrastructural context of brain tissue"). And to fulfill the promise of the chemistry is automation (robotic sample handling), imaging (light-sheet microscopy at scale) and software (reconstruction with AI and standardized annotation).
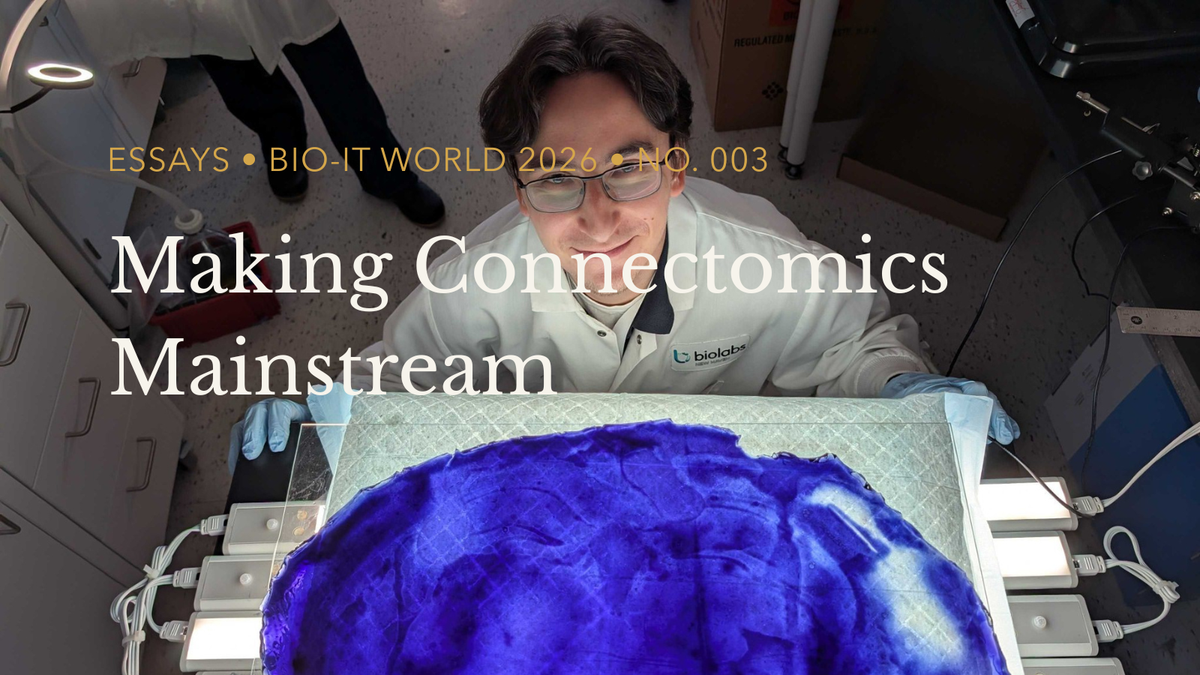
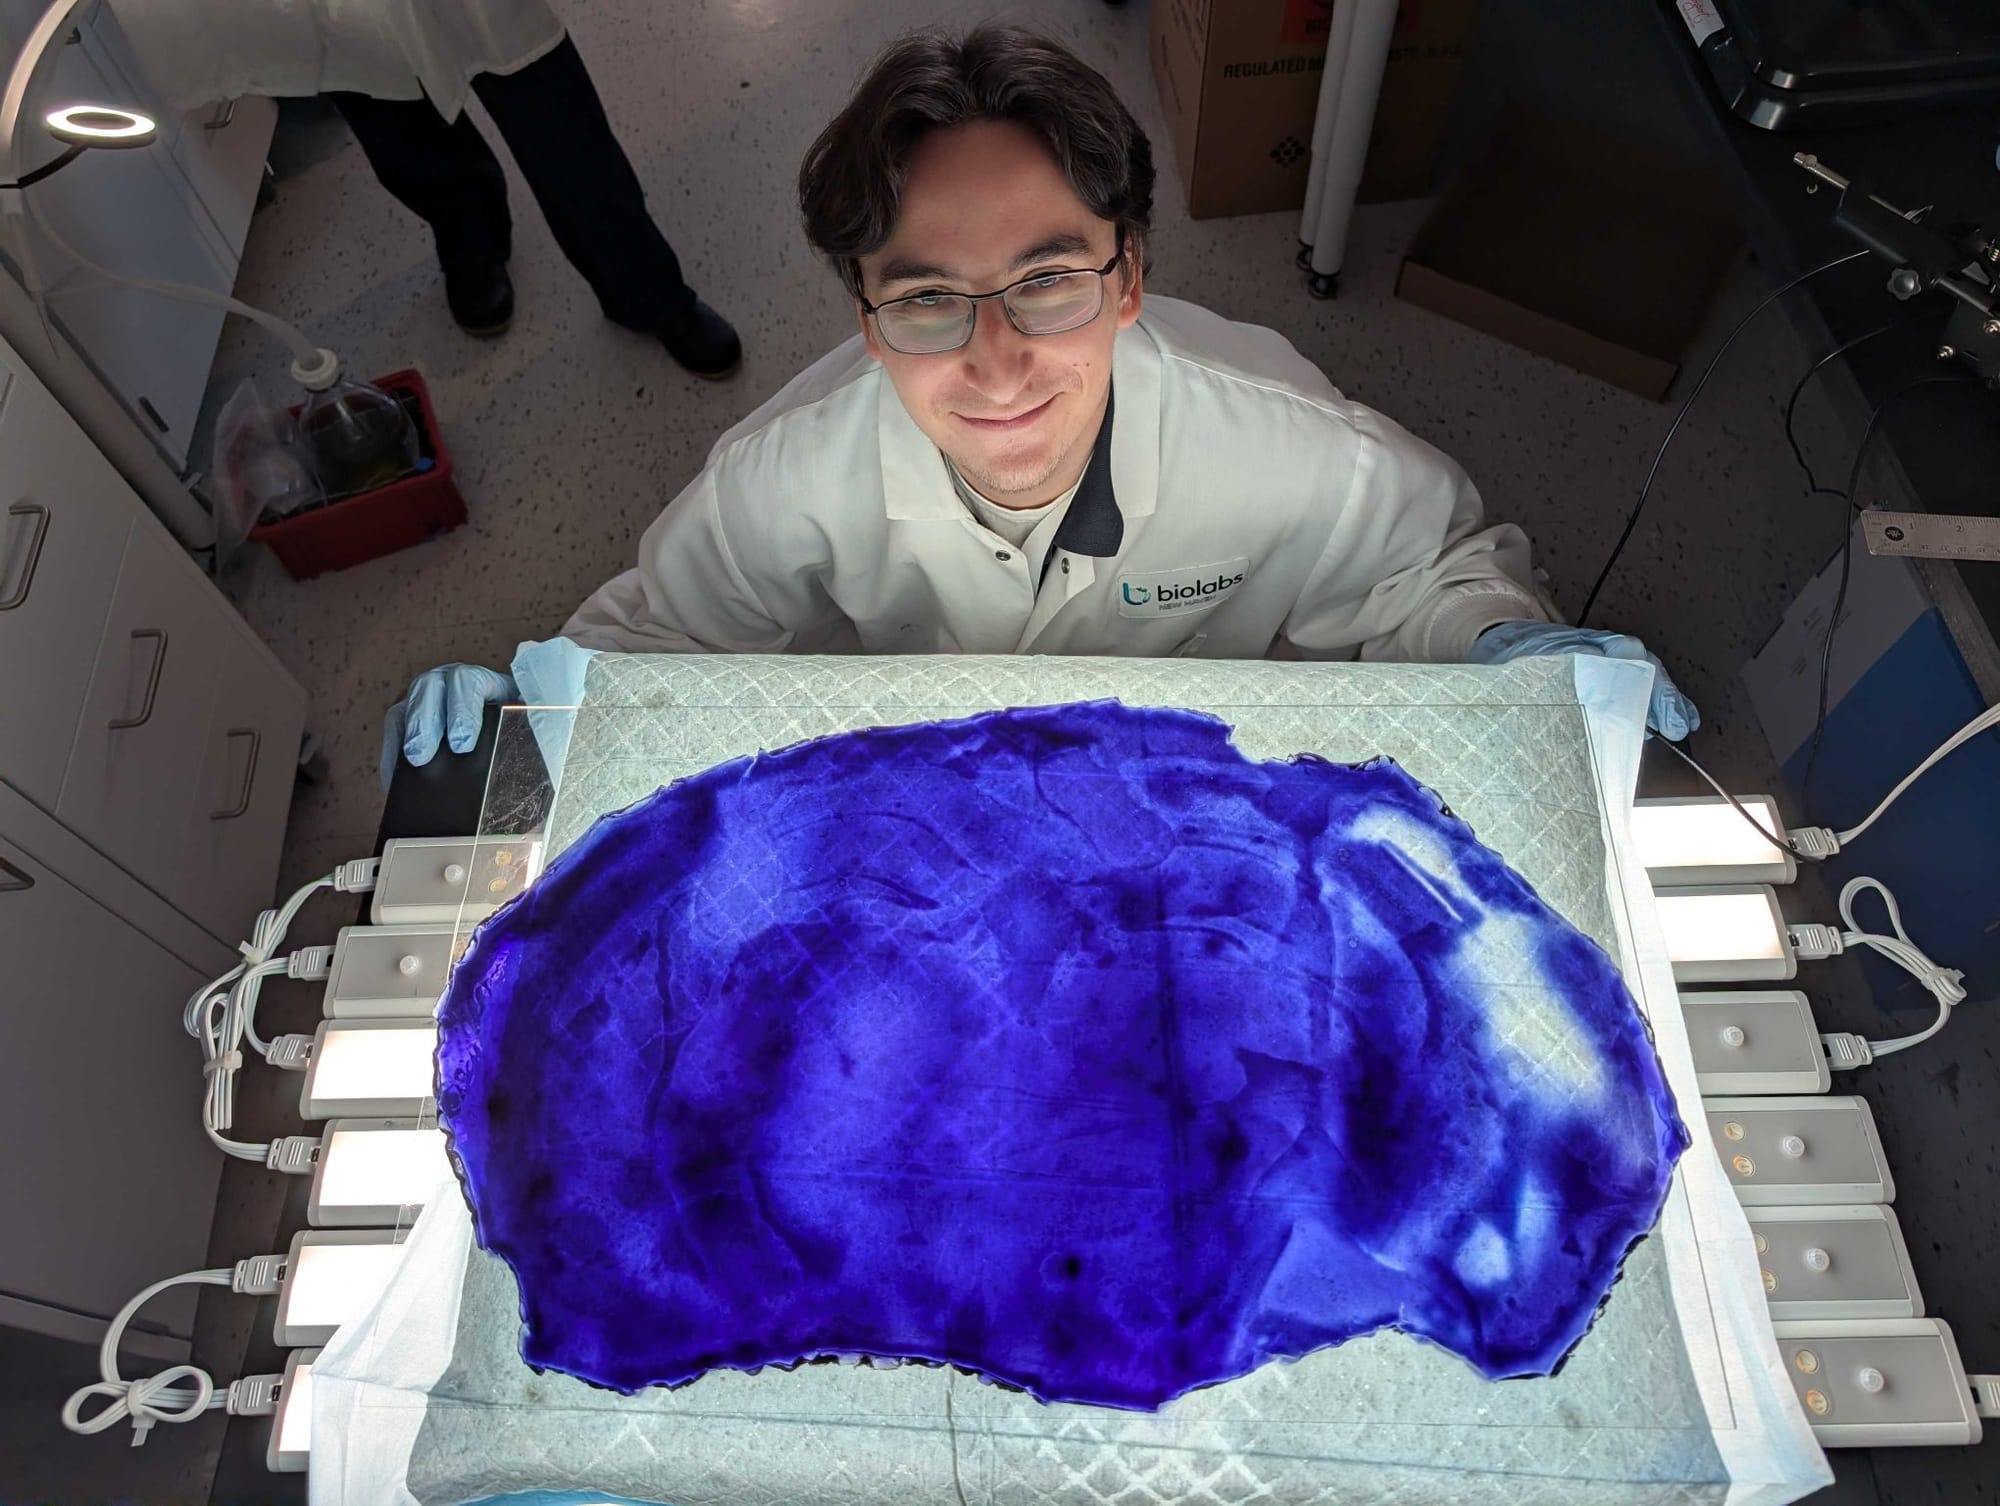
And then this surprising photograph, to show what she meant by “pan-staining”: an expanded mouse brain section, now the size of a cafeteria tray. Truly remarkable: the size of a mouse brain section is about 6 mm, or the size of a pencil eraser.
I knew this was going to be an interesting session. I had little idea however, being involved in genomics and proteomics for many years, of the imaging revolution taking place over the past decade.
Oliver Smithies, Nobel Laureate, starch expert
I’ve lived in the greater Bethesda Maryland area now for over 20 years, and living in close proximity to the National Institutes of Health intramural campus is a privilege. One of those privileges is being able to attend talks by leading scientists from around the world. And around 2008 the Nobel Prize-winning scientist Oliver Smithies gave a talk called “Two Mouse Tales” about his work on gene knockouts in mice, which has been a key scientific tool since he and others developed it in the 1980’s. (He shared the award with Mario Capecchi and Martin Evans.)
In his talk he pointed out an experiment early in his career (it was in 1954 in Toronto) while working on identifying the precursor molecules of insulin, and using paper electrophoresis techniques to separate out the proteins. The paper would curl and the insulin proteins would stick to each other and the paper itself, not separating very well. At that time starch grains were being substituted, they absorbed proteins much less than paper, and after each run the starch grain bed had to be sliced and analyzed individually.
He remembered as a child helping his mother do the laundry in Yorkshire, and in those days starch was cooked before it was used on shirt collars. He did not want to spend the next month laboriously running starch grain bed electrophoresis and painstakingly slicing each band for analysis. He built a crude gel box, found starch in the laboratory stockroom, tried the idea, and molecular-sieving gel electrophoresis was born. (Smithies O Biochem J 1955 reference.)
He made the point that I still remember: he built equipment before any commercial instrument existed, and he did it to save time.
A Rule that held for a Century
Optical microscopes have a theoretical diffraction limit (defined by Ernst Abbe in 1873 as λ / 2NA, or the wavelength (λ) divided by 2 times the numerical aperture) of about 200 nm for visible light. This means the resolving power of seeing structures close to each other as distinct objects. A microtubule is 25 nm wide, ribosomes are 15 to 25 nm wide, a nuclear pore around 120 nm. These cellular structures cannot be resolved optically.
Electron microscopy was able to get around this limit because the wavelengths are much shorter. However sample preparation (covering samples in metal) was a disadvantage. They could not be imaged as a living, dynamic organism either. Over the past 15 years (recognized by the Nobel Committee in 2014) techniques like PALM or STORM were able to get around Abbe’s limit by manipulating sparse subsets of fluorescent molecules, and even though the spots were limited by diffraction, each local group could be reconstructed computationally. These techniques are called super-resolution fluorescence microscopy.
Yet there are trade-offs here with these newer techniques, not the least of which are specialized optics (which then equate into an expensive equipment) and high light intensity (resulting in photobleaching and phototoxicity of living cells). Imaging time limits throughput as well.
In 2015, researchers at MIT had a different idea and approach. What if instead of the optics getting around the diffraction limit, the sample itself was enlarged? Can this be feasibly done, to make the cell literally 4 times as large? This “physical magnification” was published in Science in 2015 titled “Expansion microscopy”
In brief molecules have ‘anchors’ attached to them, a polymer is applied in-situ, a homogenization occurs (with enzymes, heat and/or detergent), the specimen is then expanded, and conventional microscopy images the specimen. By “molecules” these could be proteins, it could be RNA (and fluorescent in-situ hybridization probes called FISH), it could be RNA from FFPE (formalin-fixed, paraffin-embedded tissue slices, a bulwark of pathology), and it could even be iterative (two rounds of expansion).
As the polymers are hydrogels by nature, as a side-effect of the expansion the tissues and cells become transparent because these are mainly composed of water.
In an independent development, tissue clearing technologies (i.e. CLARITY, 3DISCO, CUBIC) were also invented right about the same time (for CLARITY, Chung and Deisseroth et al. Nature 2013 “Structural and molecular interrogation of intact biological systems” and 3DISCO Erturk and Dodt et al Nature Protocols 2012 “Three-dimensional imaging of solvent-cleared organs using 3DISCO”) and a company LifeCanvas is commercializing it.
These techniques are distinct from expansion microscopy, however there exists opportunities to combine these methods. The field races ahead.
The Connectome and Pan-Expansion Microscopy
In 2020 a remarkable publication reconstructed a full adult fly brain using electron microscopy (Scheffer LK and Plaza SM et al eLife 2020 “A connectome and analysis of the adult Drosophila central brain” ) While a tiny fraction of the human brain (the fly brain has about 100,000 neurons, compared to about 86 billion in humans, so a ratio of about 860,000-fold smaller), this effort involved slicing 8 nm sections and integrating the electron microscope-generated images using machine learning. In 2024, a cubic millimeter of human cortex, about 57,000 cells and 150 million synapses, was sliced into 5019 sections with an average thickness of 34 nm. (Shapson-Coe and Lichtman et al Science 2024 "A petavoxel fragment of human cerebral cortex reconstructed at nanoscale resolution") The EM images produced totaled 1.4 petabytes of data.
On top of the Drosophila brain characterized by the Janelia Research Campus in 2020, in 2024 a group of Nature papers were published called FlyWire primarily led by groups out of Princeton and the Flatiron Institute (the flagship paper by the FlyWire Consortium). This wiring diagram of an adult Drosophila involved 139,255 neurons, mapping 54.5 million synapses and is a definitive work of a whole brain connectome. An editorial in the same Nature journal is titled “The fly connectome reveals a path to the effectome” (Pospisil and Pillow et al.) delineated the importance of associated annotation of cell classes, cell types, cellular lineages and neurotransmitter classifications.
These efforts are remarkable in scope, in ambition, in expense and in time. However, electron microscopy provides, as M’Saad’s first slide indicated, only structural information. It could show the physical connection, but nothing of the molecular entities involved.
Let’s return to the remarkable image of a single expanded mouse brain section. This expansion technology provides not only structural context (protein and lipids stained like an electron micrograph), but also molecular identity, and measured with standard laboratory technology, a confocal microscope.
M’Saad said in her introduction electron microscopy offered structure information (connectome); fluorescence microscopy offered molecular information (whether RNA or protein in spatial context, the spatial transcriptome or spatial proteome or spatial multi-omics to generalize); what should the third group be called, combining structural with molecular information?
Expansion microscopy offers connectomics and spatial multi-omics, so a new term would be suitable. The technology apparently is ahead of the language available to describe it. And being able to combine both the connectome with spatial multi-omics at the scale of an entire tissue, a wiring diagram with molecular details on every component node within the diagram, for now this can be best described as “molecular connectomics”.
One concern is the validation of the expansion technology. The isotropic nature (ensuring the structures expanding in three dimensions retain their relative topology) of the technique has shown precision down to 4 nm (Reference 1). Their development has been to not be limited in choice of molecular target; one paper indicates of more than 100 antibodies against different targets tested, successful measurements were obtained from over 80% of them (ibid). And the technical development of the company has been in sample preparation (developing an automated system for pan-staining entire organs) in conjunction with a light-sheet microscope similarly scaled for imaging large slices.
As far as the business model and prospects for the company Panluminate, two areas of valuable IP are apparent: the first is around what is unique and valuable about the expansion chemistry rather than the equipment, the second would be value embedded in their analysis methods. The technical and engineering risk on the equipment they are building (the aforementioned pan-staining system and the light-sheet microscope) are refreshingly low. They won’t need (or at least should not need) to be developing many technologies on the hardware side from scratch.
Panluminate’s Commercial stance
As a commercial entity, Panluminate’s co-founders are Dr. M’Saad and Dr. Jörg Bewersdorf. These are the first and last authors on the aforementioned Nature Biotechnology paper from late 2025.
A note about Bewersdorf: he is also a member of Panluminate’s Scientific Advisory Board and expert in super-resolution microscopy. He trained in Dr. Stefan Hell’s laboratory at the Max Planck Institute in Gottingen, where STED microscopy led to Hell’s 2014 Nobel Prize in Chemistry. As a co-inventor of the pan-expansion microscopy technique, he bridges the established world of super-resolution fluorescence microscopy and expansion microscopy using conventional confocal and light-sheet optical microscopy.
With $15M in non-dilutive funding (grants from DARPA, SBIR and Wellcome Leap) and a customer list that include Eli Lilly, The Allen Institute, and Calico (the Alphabet company), Panluminate is impressive on the one hand as successful in garnering support, and yet at the same time invites some skepticism on why they have not raised funds to expand their effort.
Asked why they haven’t accessed investor funds and what they expect their funding structure to be, in the Q&A after her presentation Dr. M’Saad said she wanted to “make connectomics mainstream”, and that it “needs to be productized; it needs to be Illumina”. As one who was at Illumina in the early days, the technology enabled science to leap forward, first with the Human HapMap and genome-wide association studies enabled by microarrays, and then the wide world of genomics applications and eventually clinical applications enabled through Solexa next-generation sequencing. The underlying technology enabled key applications impossible to accomplish before. Making a technology mainstream depends upon the pull of real-world applications driving demand.
She added they are moving to commercialize, and left it at that.
The audience at Bio-IT World definitely had investors in it; the organizers did have a standalone conference called the “Bio-IT World Venture, Innovation & Partnering Conference” the day before her plenary session as part of the program.
As far as the market goes for spatial transcriptomics, spatial proteomics and FFPE transcriptomics, these are all well established (and enormous). There are several dozen companies pursuing spatial transcriptomics. Spatial protein analysis is combined on the respective spatial transcriptomics platforms. FISH is FFPE transcriptomics for single genes, with approved diagnostics decades old. However outside of an illustration of the technology applied to mapping amyloid plaques in Alzheimer’s Disease patient samples, there was not much in the way of application data, and this was only one protein target. She showed no multiplexed protein data (much less proteome data), no transcriptome data, no FFPE proof-of-concept. The potential is there.
Oliver Smithies’ Notebook
Oliver Smithies finished his NIH talk with a photograph of his lab notebook from last week. Several pages throughout his career would illustrate eloquently his progress, his triumphs, and his failures. The note is still visible from the Saturday afternoon in 1955 when he tried the cooked starch for electrophoresis on a handmade gel box. He wrote “very promising”.
The photograph of his lab notebook was full, dated only a few days before Smithies gave his talk. At the time he was in his late 80’s, and worked every day for years after.
That starch gel enabled him and countless other scientists after him to see proteins. Seventy years later I see a polyelectrolyte hydrogel that allows a company to reveal an entire brain’s wiring with protein identity in 3D.
This can save a lot of time.
References:
- Wassie AT and Boyden ES et al. Nature Methods (2019) Expansion microscopy: principles and uses in research. https://www.nature.com/articles/s41592-018-0219-4